 In the broad class of trading strategies, it is possible to generate profits when the price gains “momentum”. When we talk about momentum, we are talking about strength, impulse, and trend. In general, big profits come with impulsive movements. In other words, consistent traders make money when they follow the trend.
A Different Way to Trade
During a long time, the Wall Street lemma “buy low, sell high” has been the main advice to novice traders, and even, a way to the ruin. Under this point of view, the common way to trade has been to look at the reversal level or “reverse the market” vision. This perspective, sound valid, and even someone can say that “this way can provide an edge”. But the question is how much risk/reward could provide this trading perspective?
A different way to think the market and trade is the Momentum Investing, its central concept being “buy high and sell higher”. This approach can be used in short-term and also long-term trading. In this article, we will apply Momentum Investing in long-term trading.
Undoubtedly, long term trading, or Swing Trading, is not as exciting and emotional as Day Trading, but potential profits can be much higher on swing trading. Even further, the dedication required to do swing trading is lower than day trading.
The Basics

Momentum investing is based on price strength. Specifically, its basic principle is “time and movement.” After a big move, it is when the price moves faster. It is, also, predictable that this move will retrace as a reaction of the first impulsive movement. When we see a faster advance, it means that the price is gaining momentum.
The first step is to compare the different assets considered to trade on a daily timeframe. The second step is to identify the price bias. Once detected the first impulsive move, after a breakout or breakdown, it is time to stalk the price action to spot the right place to enter in this new trend.
If we see that the price is starting a bull market movement, we should open a long position when the price dips - “buy the dips.” Conversely, if we are following a bear market trend, we should “sell the pullbacks.”
Selecting the Candidates

Assets selection for momentum investing should be considered using the daily timeframe to observe the big picture better. Choosing a directional market is essential. For example, a particular asset in which a breakout is developing could be a candidate. Then, we wait for a retracement to pull the trigger and add positions following the primary trend.
The Perfect Entry
To spot the perfect entry level from where we expect the order would follow the forecasted direction is picky. But we can adequately do that by following the price action in a shorter timeframe. For convenience, the 1-hour chart tends to reduce the noise of a minutes chart and present a panoramic view. Please consider that the breakout must be confirmed before pulling the trigger.
Managing the Risks
- Momentum Investing requires extensive time-dedication to identify the “correct” asset to trade, which affects the time decision process, especially if the momentum investor is a retail trader.
- The timing between the asset identification and the position entry, or exit, can impact the risk/reward ratio negatively.
- The Stop Loss or Invalidation Level should be defined, below the last relevant swing’s top or bottom.
- Remember to cut the losses short and let the profits run. This is Nr 2 mantra on Momentum Investing.
Closing the Trade with Class
- The first method is to close the trade is when the price shows exhaustion signals. For example: if, after the impulsive movement, the price starts to move in a range and retrace more than a specific pips quantity.
- An alternative way to exit is when the trade reaches a specific performance level — for example, 10% of trade performance.
- A different approach to close a trade is when surprise (bad or good) news has been released. That kind of events can be the starting signal for the market to start pushing in a new direction.
- Finally, a simple method to close the trade is when the price reaches some specific level. For example, the 52-weeks high/low, the all-time high, a first time round number touch (for example 3,000 pts in S&P 500), and so on.
To help you clarify the methodology, let’s present a couple of examples. Before continuing, it would be desirable to review the concepts discussed in our previous post about support, resistance, and breakouts. (read more).
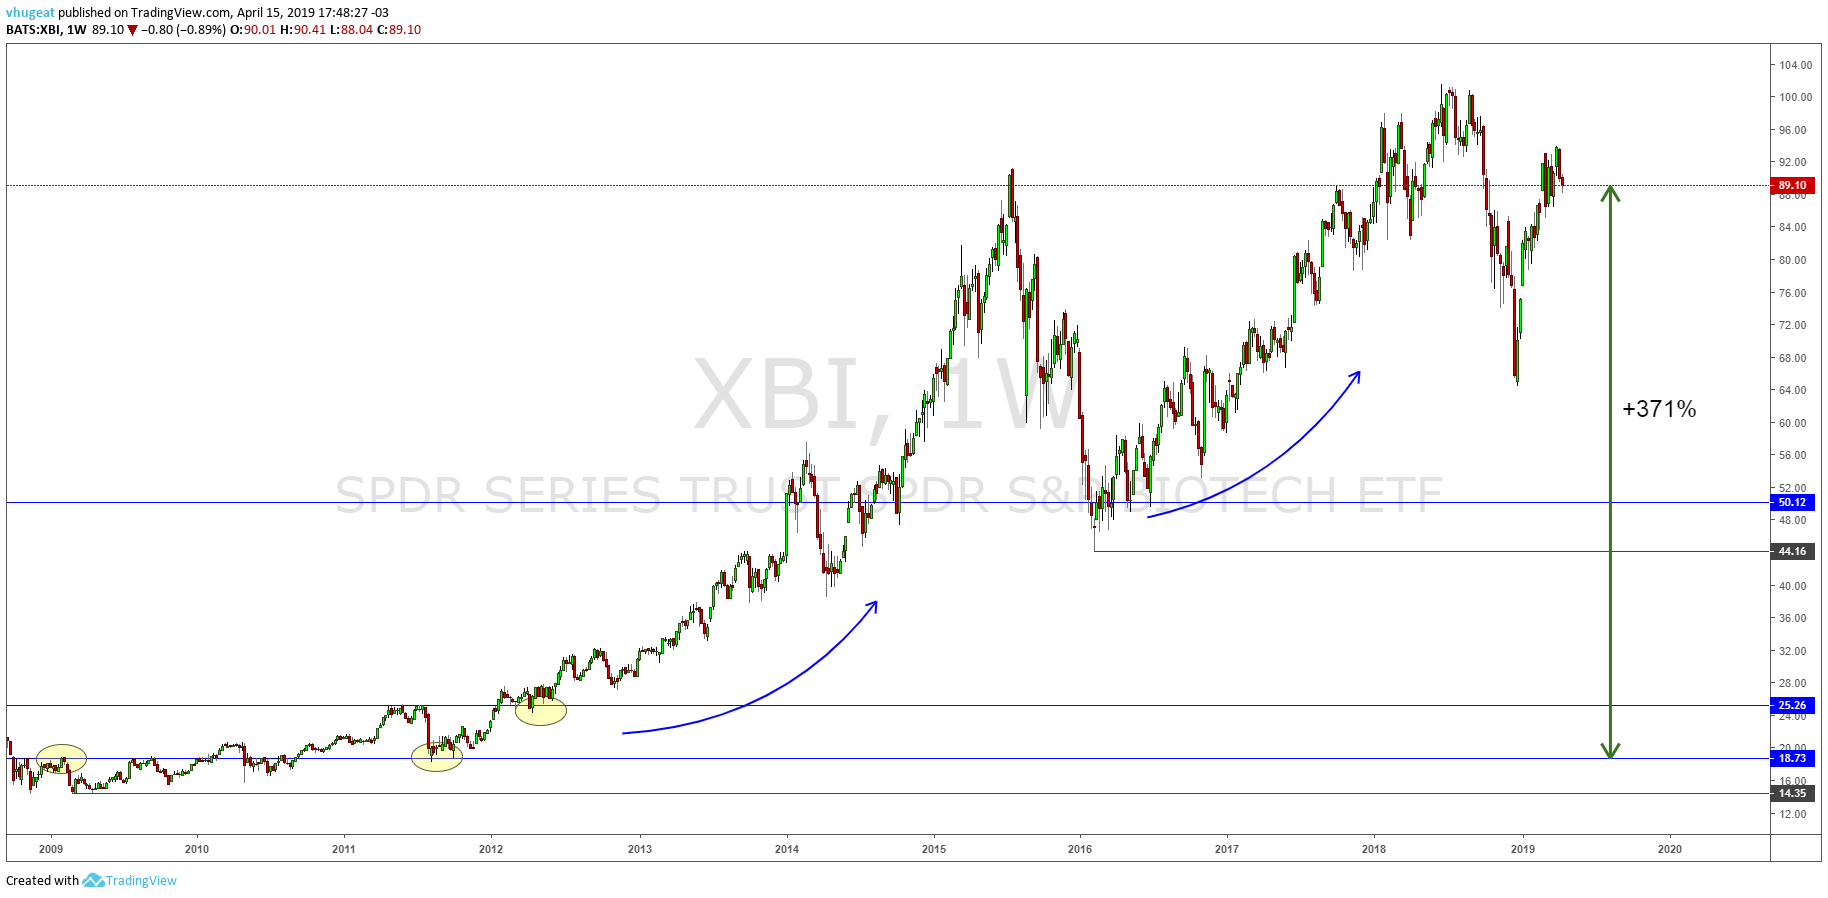
Consider the XBI ETF weekly chart. On this case, we observe a persistent bullish trend which started back in 2009. The performance reported by XBI from the first throwback in 2011 to date is over 370%. As you can see, this kind of returns is not possible in intra-day trades.
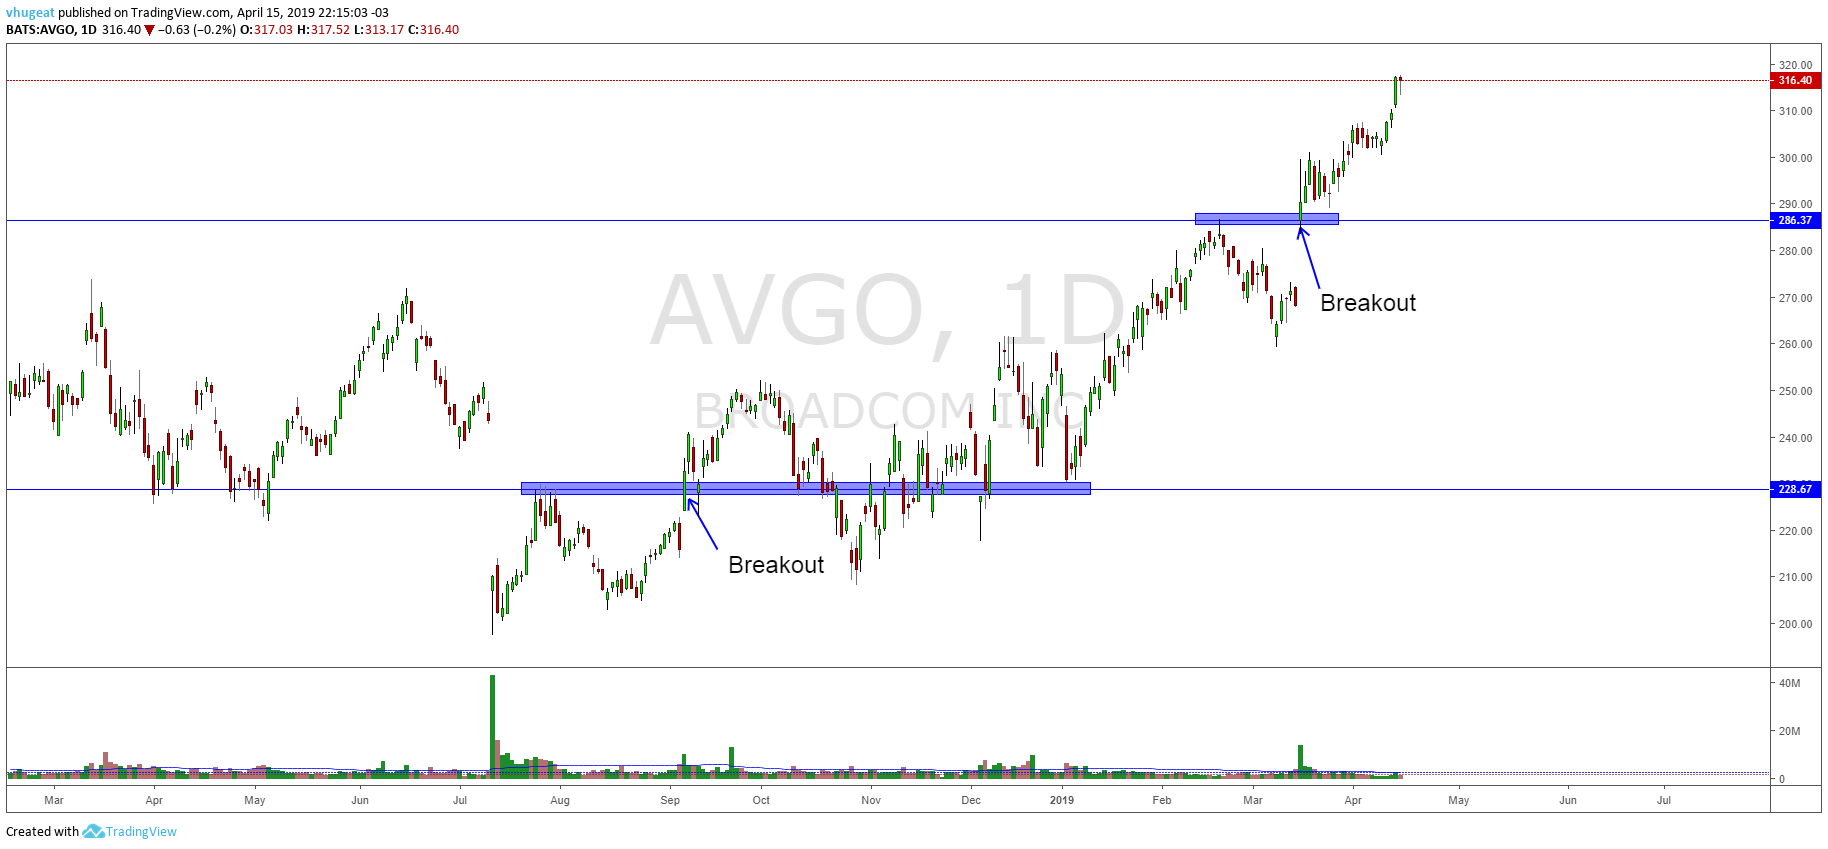
The second example corresponds to the AVGO daily chart. On chart 2, breakouts provide a bullish market bias. With this information, we will look for long positions in the throwbacks.
Chart 2
Conclusions
Summarising, the “buy high and sell higher” vision provided by the momentum investing can produce significant profits than the “reverse the market” vision. Support, resistance, and breakout concepts are essential to aid to identify possible entry levels. Remember that in trading the Holy Grail does not exist, but the key is to have an edge against the market.
The selection process is essential to decide what to trade, but timing is key to improve the risk/reward ratio. Momentum doesn’t fit all traders, because this trading method requires patience to let run trades in big trends.
A very successful long-term strategy based in momentum and breakouts is Donchian Channel, which is the backdrop of the legendary Turtle trading method, which will be developed in a future post.


