Traders trade with a trend. There is a saying in the market that “Trend is traders’ friend”. However, the price does not keep going in one direction. It often takes pauses on its way towards the trend. These pauses are called price correction. In this lesson, we are going to demonstrate how important price correction/pullback is in the price action trading.
Let us have a look at a chart.
USDJPY-Daily Chart
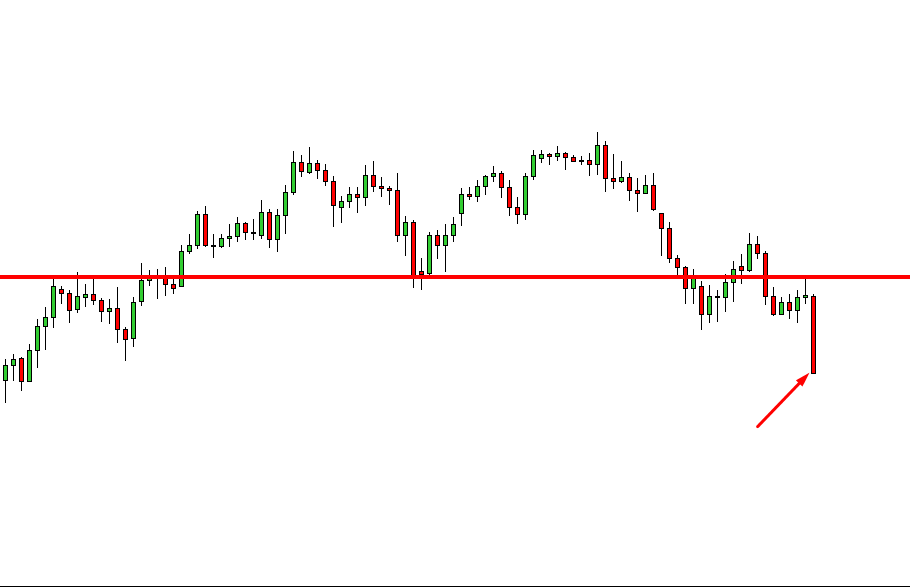
This is the daily-USDJPY chart. Look at the arrowed candle. A strong bearish daily candle came out after a daily pin-bar candle. It shows that the sellers have dominated the market. Since it is the daily chart, which shows a clear downward move, thus, traders, the H4 traders only should look for selling opportunities here. Let us flip over to the H4-USDJPY chart.
USDJPY-H4 Chart
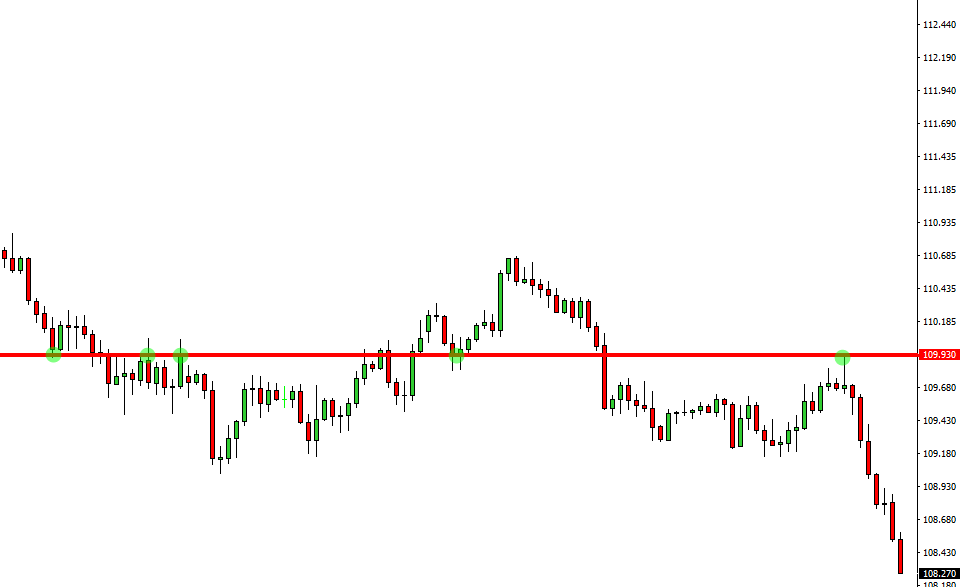
The H4 chart shows that the price has been trending from a very significant level of resistance. A pin-bar H4 candle was followed by another bearish candle, and then the price never looked back. A perfect looking selling market with which, anyone would agree as far as the H4 chart is concerned. Now the question is whether we sell right from there where the price is now? Before answering the question, let’s have a look at how the next day started.
USDJPY- H4 Chart on the Following Day
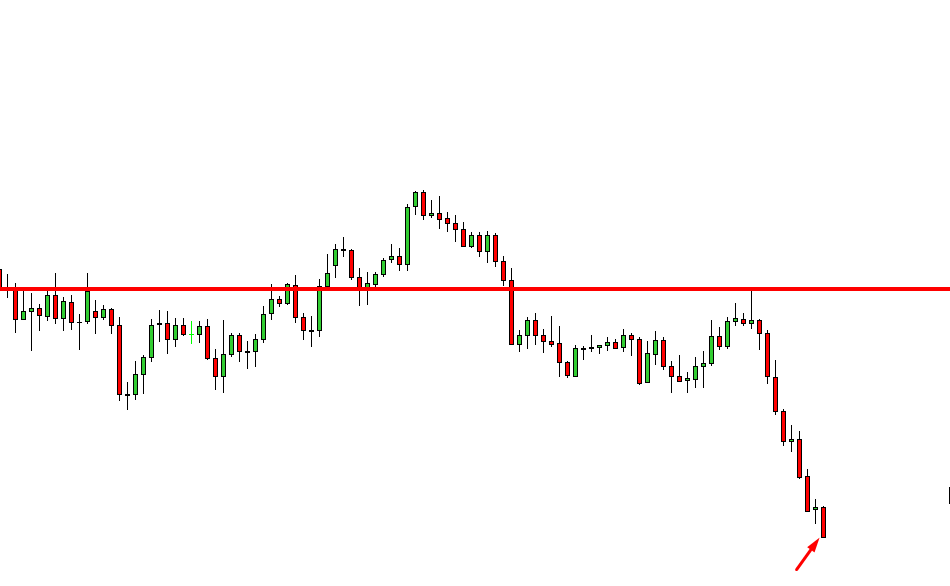
A Doji candle to start with and then another strong looking bearish candle were produced that day. However, there was no pullback or price correction. Many traders may jump into it and take a short entry. Considering the H4 chart, that would be a mistake because there is no such resistance with what a seller can place his stop-loss nearby. The nearest significant level of resistance is all the way up to where the trend started. It is an oversold market. Thus, there is a strong possibility that the price might not go towards the South anymore. It would rather either be in a range or go towards the upward. Let us have a look at what actually happened there.
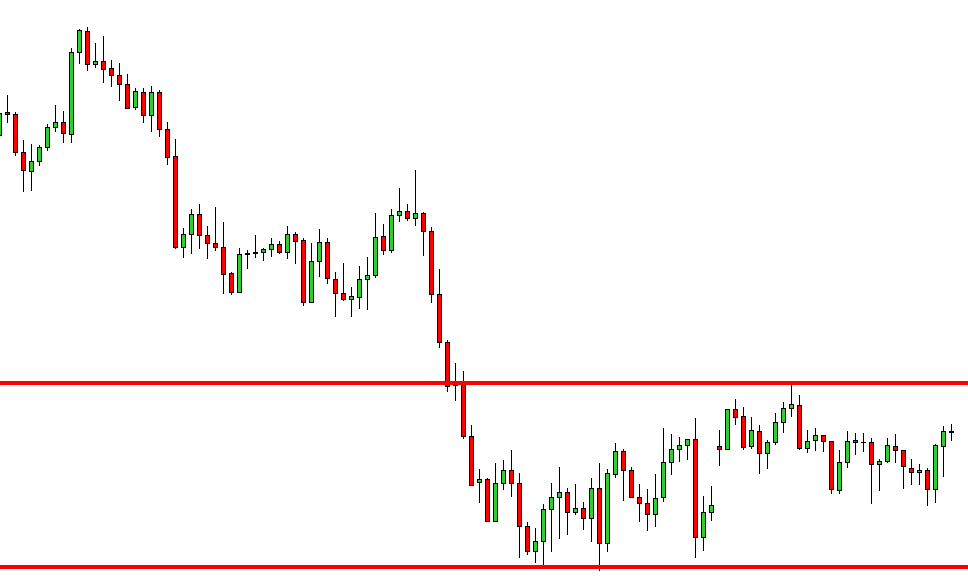
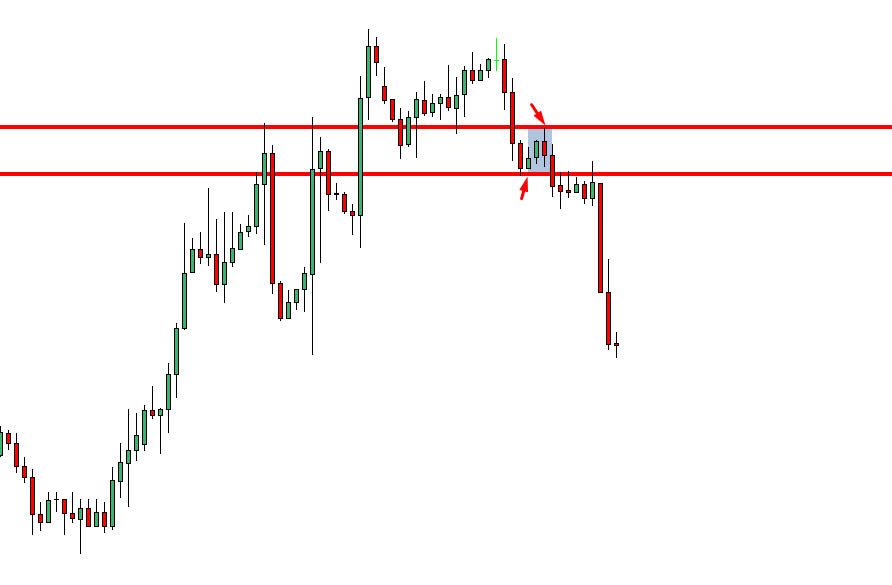
The price had a little pullback, but it was too late for the H4 traders. The next daily candle closed before producing a breakout candle. Thus, it was not a chart for the H4 traders to take entry anymore until they get another strong bearish day. An important thing to be noticed here, the breakout did take place later on. However, it did not take place right after the bearish day, which made the H4 market look like a strong bearish market. Look what happened afterwards. The price caught into a range. It just did not know where to go. This is the market where traders may never want to trade since it is almost impossible to make money out of it.
Now let us have a look at the chart below.
EUROUSD-H4 Chart
This is an H4-EUROUSD chart. After producing a clearly bearish day, the price had a pullback; produced an H4 bearish reversal candle and then made the breakout on the same day. The price did not start going towards the downside that day but took some time. However, it made a strong bearish move afterwards. The thing to be noticed here is breakout took place on the day, which was the following day of the strong bearish day.
Things to Remember
These are the things we need to remember to trade on price correction
- To trade on the H4 chart, we need to have a good-looking bullish or bearish daily candle.
- The price either has to be corrected from the same day, or on the following day.
- The breakout must take place on the following day ( after the strong bullish or bearish day)
- The correction/pullback has to be very evident on the H4 chart.
The Bottom Line
The price correction/pullback is needed on 5M to Weekly chart you may want to trade at. Professional traders do not want to buy from an overbought area or sell from an oversold area. They wait for the price to make a correction. We need to do the same. We have emphasized how to trade based on the H4 chart here. With other charts, other equations are different apart from the correction factor. This means we must remember the significance of price correction on all the charts that are used in the financial market.


